Visualizing Propositions
Suppose that and are two sets of objects. Relative to these two sets, any object can be classified in exactly one of the following 4 ways:
- The object is neither in nor in .
- The object is in but not in .
- The object is in both and .
- The object is in but not in .
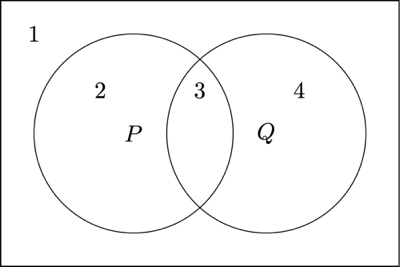
A Venn diagram is a picture that represents all the possible relationships between sets of objects. For example, the picture below is a Venn diagram for and . The square represents all the possible objects, the circle labeled with are the objects in the set , and the circle labeled with are the objects in the set . The numbers refer to the above categories that describes the objects in the region.
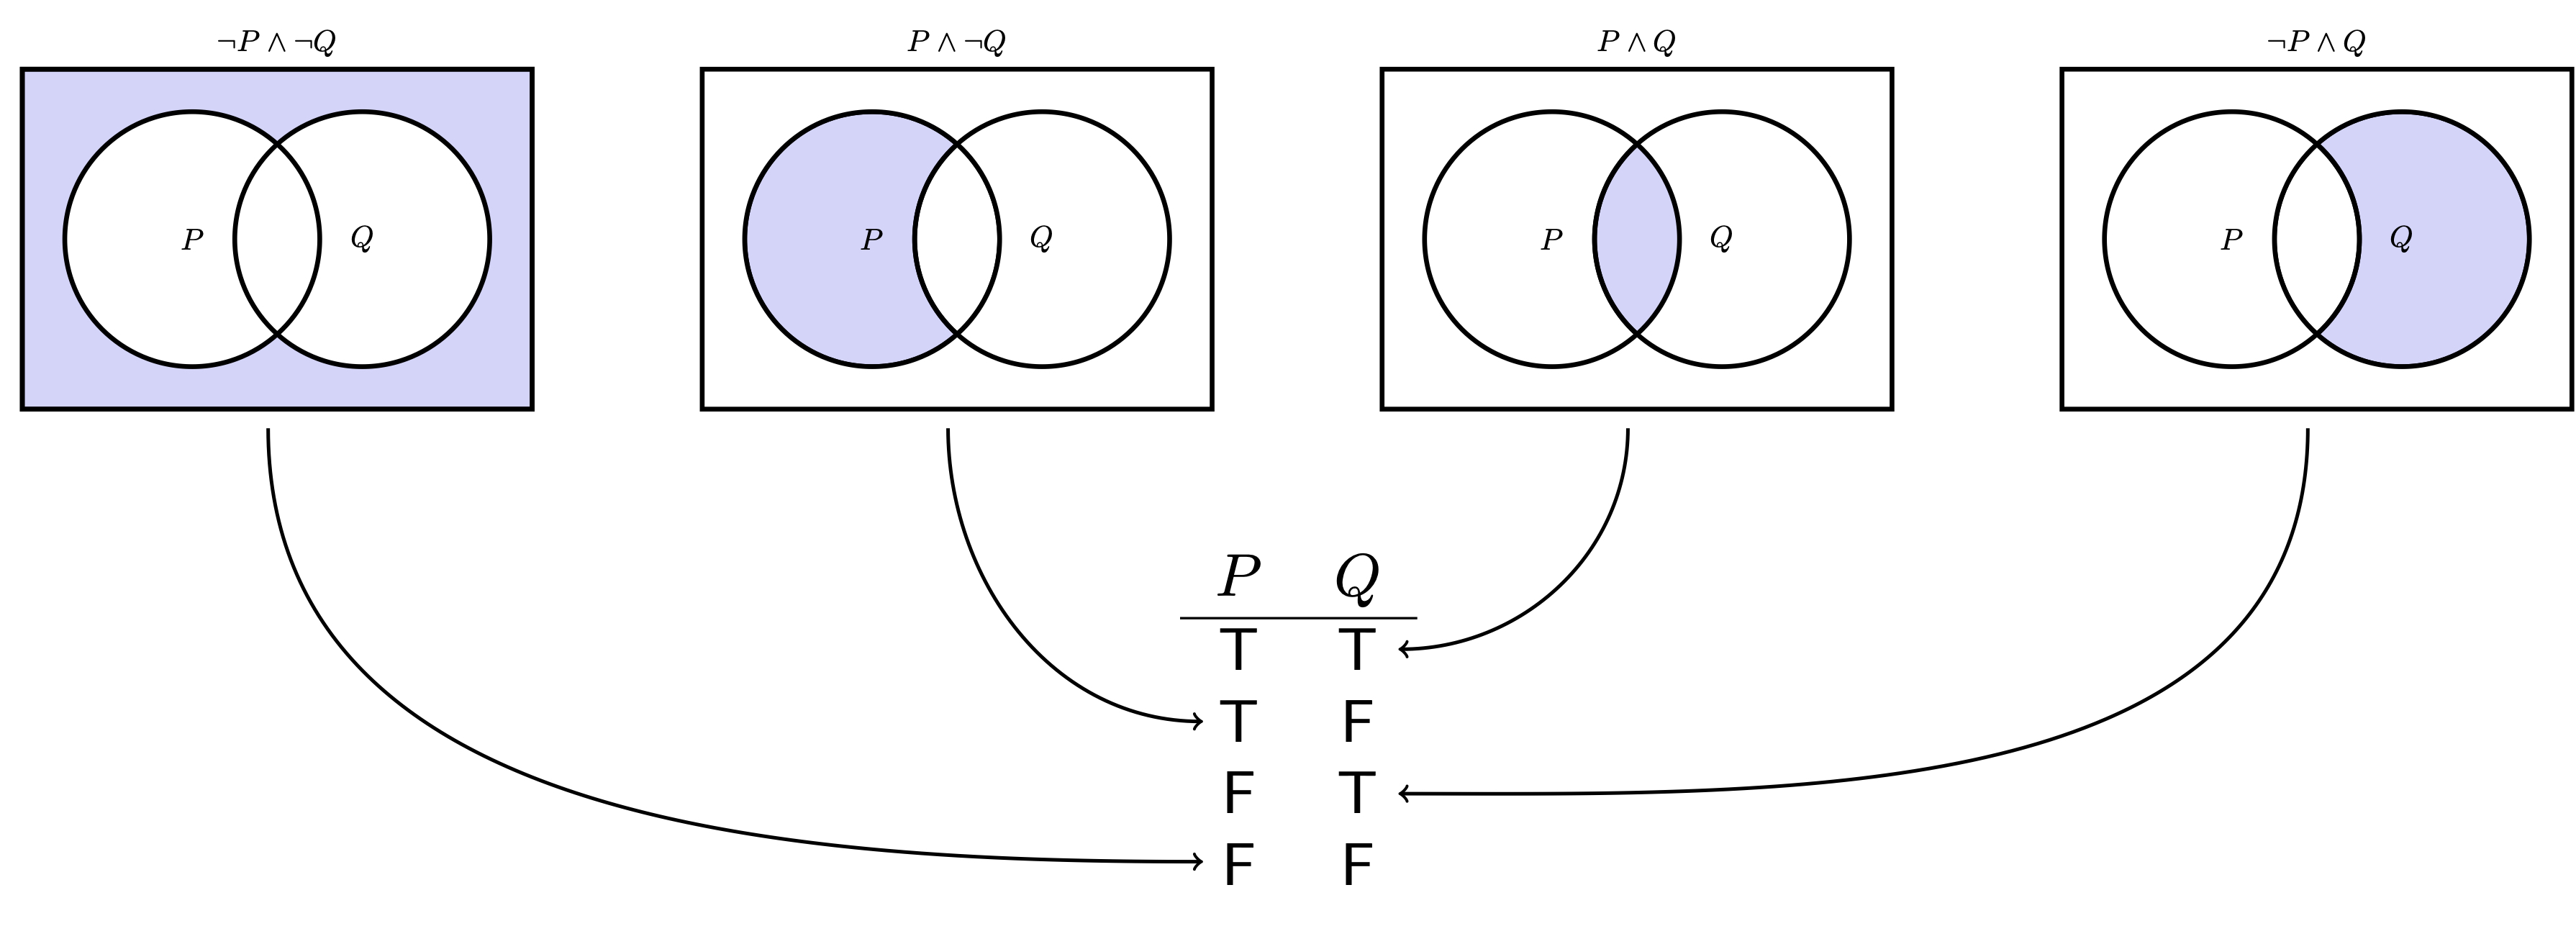
There is an important connection between Venn diagrams and propositional logic. The key idea is that formulas of propositional logic describe regions of the Venn diagram: For all formulas and , the formula refers to the region outside the the region described by , the formula refers to the region described by both and , and the formula refers to the regions described by either or . For example, in the image below, each of the 4 Venn diagrams is labeled with a formula describing the shaded region. Furthermore, each region can be associated with a row in a truth table for and .
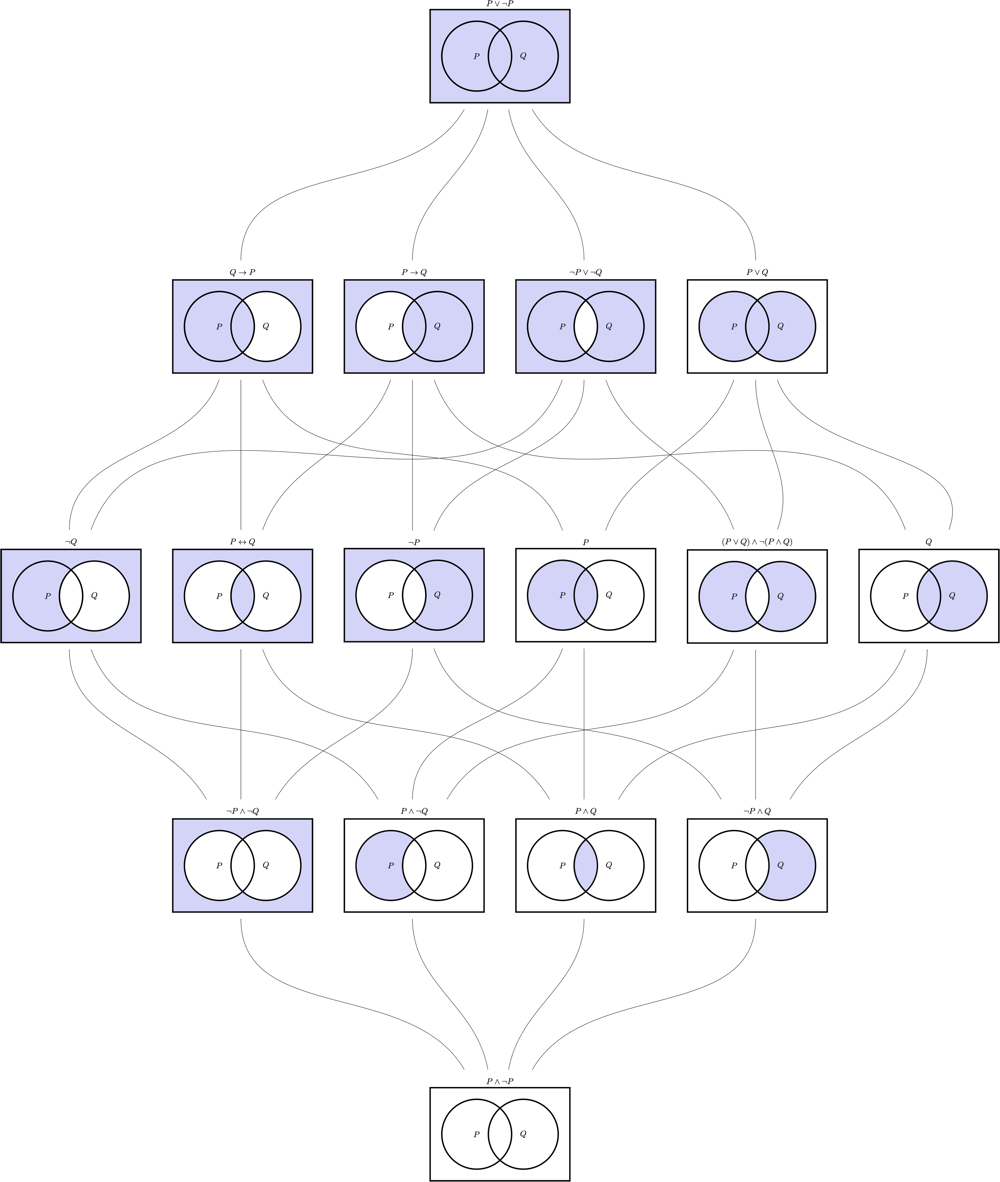
Building on this idea, we can visualize other formulas of propositional logic constructed using the atomic propositions and by shading different regions of the Venn diagram. Since there are 4 different regions of a Venn diagram for and , there are 16 different ways to shade the Venn diagram. The key observation is that any formula of propositional logic that only contains the atomic propositions or , describes one of the 16 possible shadings of the Venn diagram for and . The image below contains all 16 different shadings, each labeled with a formula that describes the shading.
The Venn diagram at the bottom of the image has no regions shaded, the 4 Venn diagrams in the 1st row have exactly 1 region shaded, the 6 Venn diagrams in the 2nd row have exactly 2 regions shaded, the 4 Venn diagrams in the 3rd row have exactly 3 regions shaded, and the Venn diagram at the top of the image have all 4 regions shaded. There is a line drawn from a Venn diagram to a Venn diagram immediately above it when all regions shaded in the Venn diagram below are also shaded in the Venn diagram above.
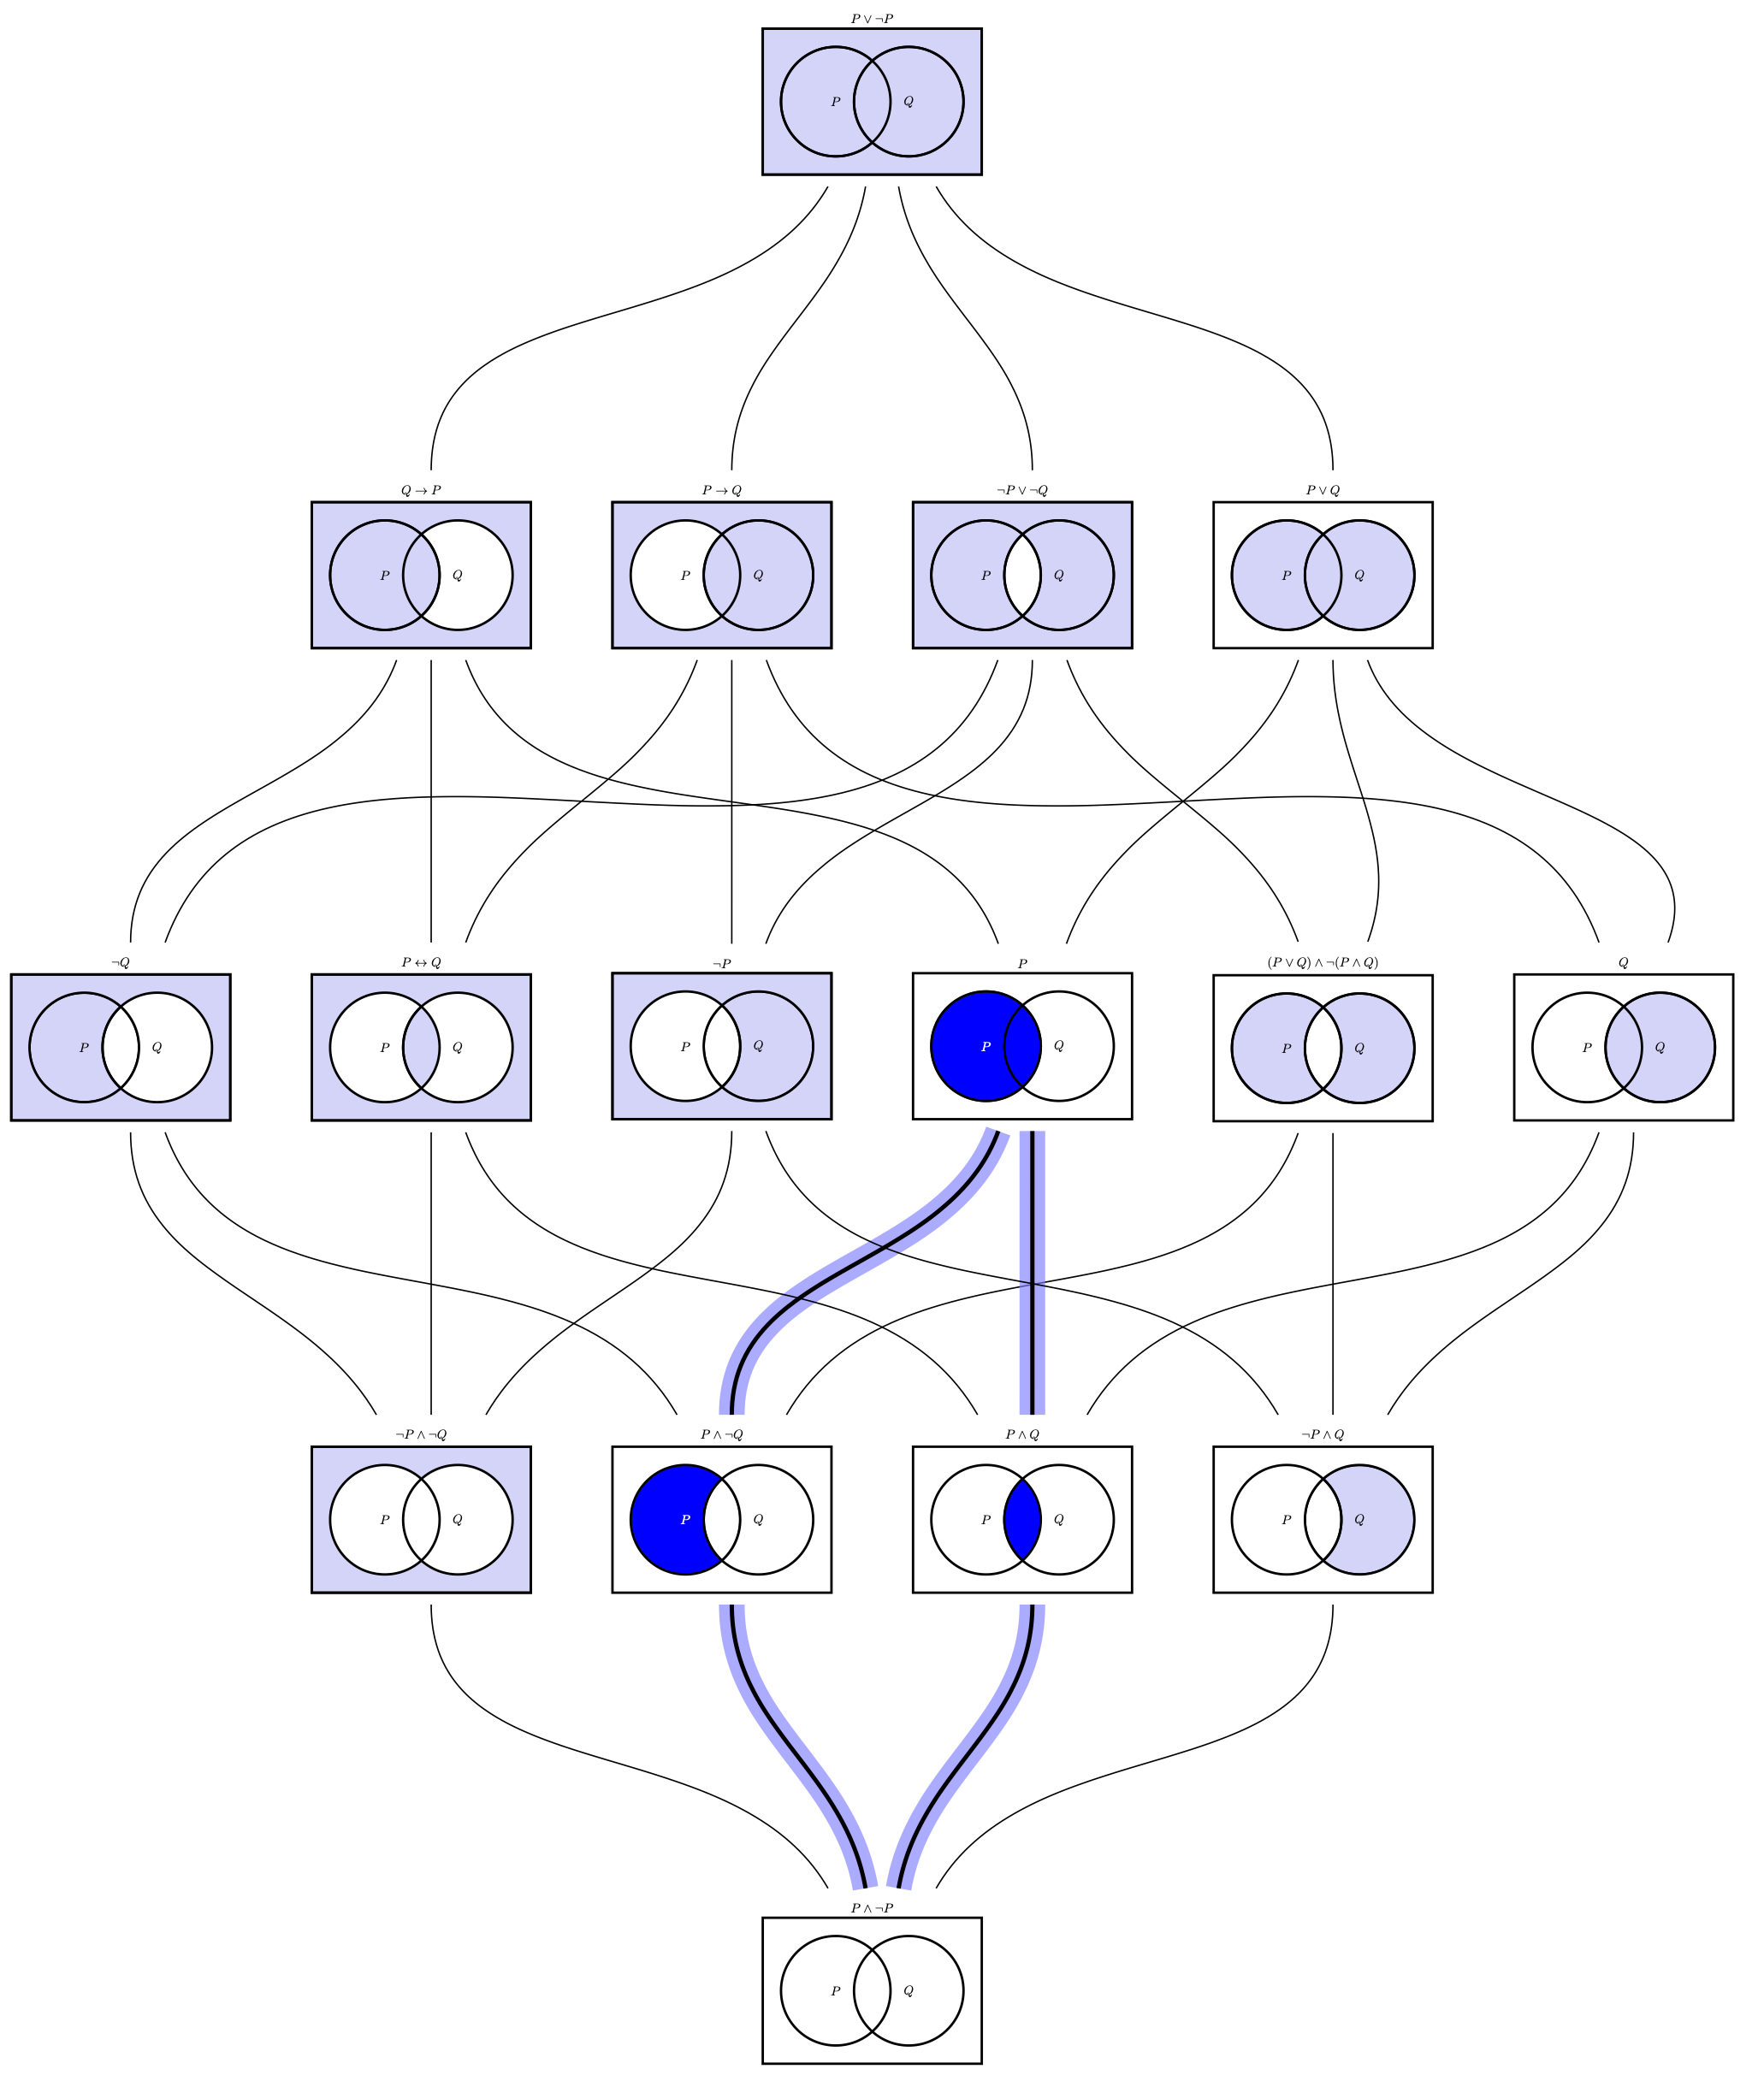
The above image is a very useful way to visualize important relationships between different formulas of propositional logic. There are three key observations:
- Any formula of propositional logic that only contains the atomic propositions or is tautologically equivalent to one of the formulas labelling a shading of the Venn diagram in the following image.
- For all formulas and , if and only contain the atomic propositions and , then whenever there is a path from a Venn diagram whose shading is described by to Venn diagram whose shading is described by .
- For all formulas , and , if , and only contain the atomic propositions and , then is tautologically equivalent to whenever there is a line drawn from both the Venn diagram whose shading is described by and to Venn diagram whose shading is described by .
For example, the following facts:
- ,
- ,
- ,
- ,
- , and
are illustrated by the highlighted lines in the following image:
Tutorial
- Lecture
- Slides
Euler Diagrams
It is important to note that in a Venn diagram, not all of the regions must contain objects. For example, suppose that we are considering sets consisting of the ten digits: or . Suppose that is the first three digits. We express this by writing . The braces "" and "" are used to denote a set of objects (in this case, a set of digits). Suppose that is . In the following Venn diagram for the sets and , I list the set of elements in each region.
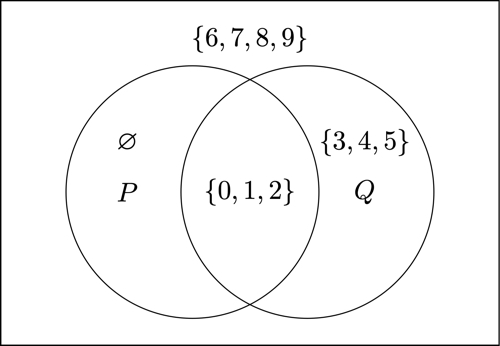
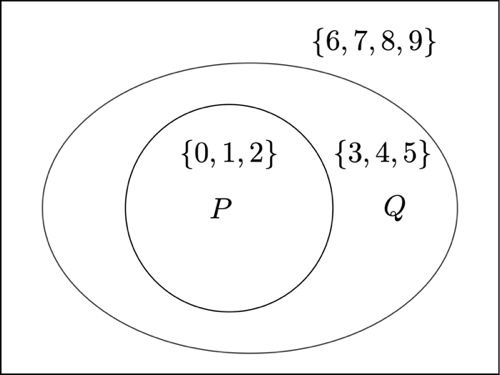
Note that the symbol "" is used to describe the region consisting of objects that are in but not in . This symbol means the empty set: That is, the set with no elements. Of course, there are no numbers in that are not in since every number in is also in . In this case, it is more convenient to draw the circle completely inside the circle to indicate that everything in is also in . When not all possible regions are depicted the diagrams are called Euler diagrams.
We can also use Euler diagrams to illustrate logical relationships between formulas of propositional logic. The idea is to treat a formula as the set of truth value functions that make the formula true. Then, means that every truth value function that is in the set of truth value functions making true is also in the set of truth value functions making true.
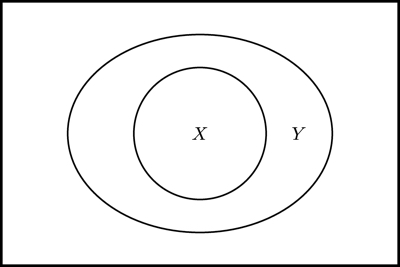
Draw an Euler diagram of two formulas and when :
Draw an Euler diagram of two formulas and that are mutually exclusive (i.e., there is no truth value assignment that make both formulas true):
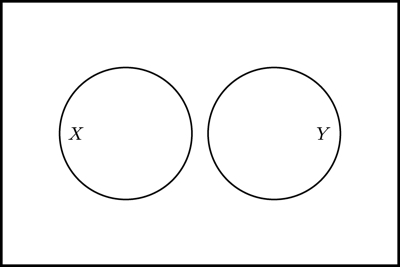
Note that there may be a truth value function that makes neither nor true.
Practice Questions
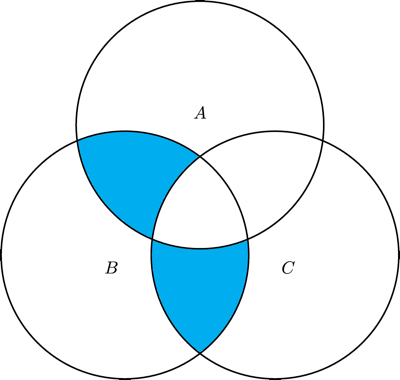
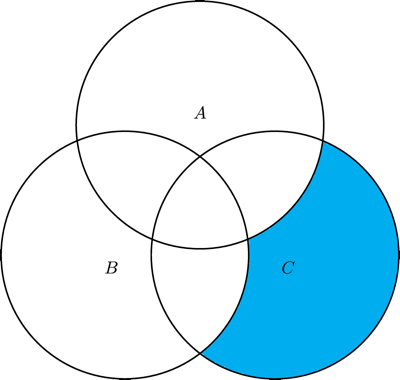
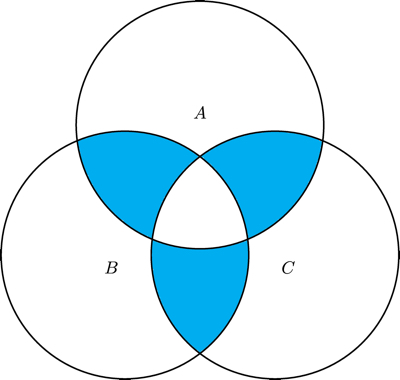
- Suppose that there are three propositions , and . Draw a Venn diagram from these three prpositions and shade the region corresponding to .
- Suppose that there are three propositions , and . Draw a Venn diagram from these three prpositions and shade the region corresponding to .
- Suppose that there are three propositions , and . Draw a Venn diagram from these three prpositions and shade the region corresponding to .
- Suppose that there are three propositions , and . Draw a Venn diagram from these three prpositions and shade the region corresponding to .
- Suppose that there are three propositions , and . Draw a Venn diagram from these three prpositions and shade the region corresponding to .
- Suppose that there are three propositions , and . Draw a Venn diagram from these three prpositions and shade the region corresponding to .
- Consider the following Venn diagram. What is a formula corresponding to the shaded region?
- Consider the following Venn diagram. What is a formula corresponding to the shaded region?
- Consider the following Venn diagram. What is a formula corresponding to the shaded region?
- Draw a Euler diagram of two formulas and where and .
- Draw a Euler diagram of three formulas , , and such that .
- Draw a Euler diagram of three formulas , , and such that :